Documentation
Overview
BugBase is a microbiome analysis tool that determines high-level phenotypes present in microbiome samples.
BugBase will determine the proportion of each microbiome sample that is:
- Gram Positive
- Gram Negative
- Biofilm Forming
- Pathogenic Potential
- Mobile Element Containing
- Oxygen Utilizing
- Oxidative Stress Tolerant
BugBase will then plot and compare the proportion of each microbiome with a given phenotype according to the treatment groups you specify within a mapping file.
Inputs
OTU Table
An OTU table is required to run BugBase. The OTU table should be:
* OTU picking for 16S sequencing can be done using this OTU picker, or a similar tool. Shotgun metagenomic sequencing must be done using the workflow here.
You can easily convert your OTU table to a JSON version BIOM file by following the documentation for BIOM. To filter a large OTU table, you can use the QIIME scripts listed here. Large OTU tables can also be analyzed by downloading and installing BugBase.
A sample OTU table can be found on the downloads page.
Mapping File
A mapping file is required to plot and analyze your data by treatment group. Remember to never store confidential information in this file. Your mapping file should:
A sample mapping file, similar to the one shown below, can be found on the downloads page.
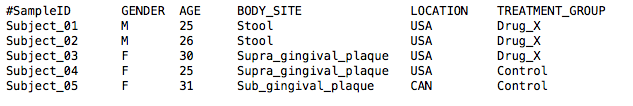
Column Header
You can specify which column in your mapping file separates your treatment groups for plotting.
For example, the column header in the mapping file above used to generate the plot below was BODY_SITE.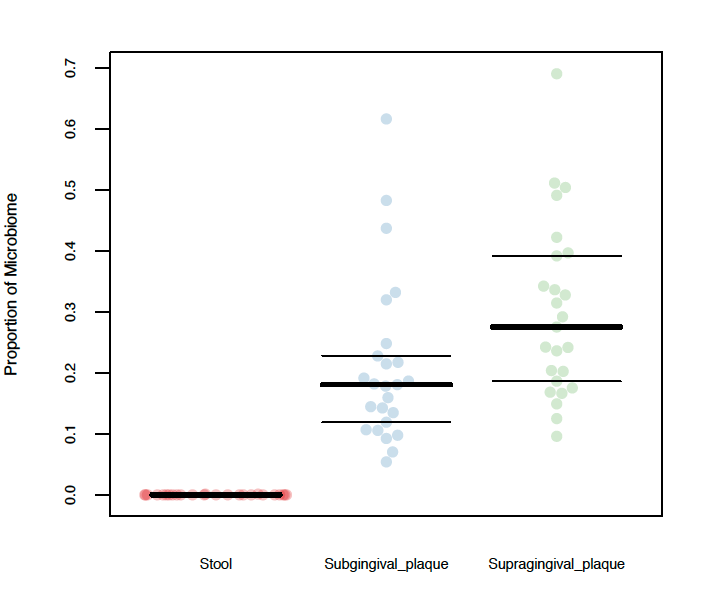
Options
Shotgun Metagenomic Sequencing Data
By default, BugBase analyzes 16S data picked against the Greengenes 97% reference set. If you would like to analyze shotgun sequencing data, please pick OTUs using the IMG database. To do so you can follow the directions listed near the bottom of the page here.
Discrete or Continuous Data
By default, BugBase will analyze and plot your data based on discrete groups within the map column you specify.
If your data is continous, you can select the 'Continuous Data' option instead.
Variance or Coefficient of Variance
By default, BugBase will analyze and plot your data using a threshold that has the highest variance across all samples.
If you choose to use the coefficient of variance (which is the ratio of the standard deviation to the mean), you can select the 'Use Coefficient of Variance' option instead.
Predict KEGG Module Presence
Instead of predicting and plotting the default BugBase traits, you can also predict and plot KEGG level three modules. If predicting KEGG modules, you must specify which modules using the 'Specific Traits or Modules' box (see below).
Centered Log-Ratio Transformation of Data
Instead of converting to relative abundance, you can centered log-ratio transform the data. This helps prevent issues with the compositionality of sequencing data.
Specific Traits or Modules
You can specify which traits or KEGG modules you would like to plot. This should be a comma-separated list with no spaces. Specifying which modules to plot is required if using KEGG. A list of the KEGG module names can be found downloads page.
If left blank (default), BugBase will plot all default traits.
Specific Groups
You can specify which groups within the specified column you would like to plot. This should be a comma-separated list with no spaces.
For example, if you would like redo the plot above with only Stool and Supraginginval_plaque (omit Subgingival_plaque), you would specify Stool,Supragingival_plaque in the Specific Groups field.
If left blank (default), BugBase will plot all unique identifiers in the column specified.
Specific Thresholds
The threshold is the percentage of genes within a category that an OTU must posses to display a phenotype. For example, a threshold of 0.05 would mean an OTU must possess 5% of the genes within the biofilm formation gene set to be able to form a biofilm.
You can specify which threshold you would like to set for all phenotypes. The higher the threshold, the more stringent you are in deeming an OTU to possess a phenotype. The threshold must be between 0 and 1.
If left blank (default), BugBase will use the threshold with the highest variance in your data, irrespective of treatment groups. It will set a different threshold for each phenotype according to the variances reported. If you select 'Use Coefficient of Variance' it will use the coefficient of variance to set the thresholds instead.
Plot All Samples With No Mapping File
You can also plot the phenotype proportions of your samples without a mapping file.
This option will report the mean proportion of your samples that possess the given phenotype. No statistical analyses will be performed.
Output Prediction Table Only
If don't want to plot your predictions, BugBase can return just the prediction table. You will still have to specify if you'd like to use the default traits or KEGG modules. By default, this mode will run the predictions for all the possible traits/modules, and does not require a mapping file. You can choose to use variance or coefficient of variance and you can also use a threshold of your own choosing.
Outputs
- 16S copy-number normalized OTU table
- Threshold variances for each microbiome phenotype
- Threshold variance plots for each microbiome phenotype
- Microbiome phenotype plots
- Statistical analyses (Mann-Whitney U Test or Regression/Correlation Test)
- OTU contributions for each phenotype
Additional Phenotypes
Additional phenotypes can be easily added to your BugBase analysis. Currently we accept KEGG IDs as the inputs for custom traits. Custom analysis can be done by downloading
Disclaimer
Uploaded data and resulting analyses are retained on the BugBase server for up to 2 weeks. BugBase users retain ownership and intellectual property rights of their uploaded data and resulting analyses. Uploaded data and resulting analyses will only be accessed by the user, unless the user specifies otherwise.
Citing BugBase
The BugBase manuscript is currently available as a preprint here: BugBase Preprint,
BugBase's precalculated files were created with the help of other softwares. The following should also be cited when using BugBase: PICRUSt, IMG, KEGG and PATRIC.
Questions?
Please contact us at bugbase@cs.umn.edu with any questions.